 outage map explained: how it works, recent 2026 disruptions, and how to check if the platform is down right now.)
When X, the platform formerly known as Twitter, stops loading or starts throwing errors, one of the first things users search for is a twitter outage map to figure out whether the problem is isolated to their device or affecting people everywhere. These maps, powered by crowd-sourced reporting tools, have become an essential resource for anyone trying to understand what’s happening during a service disruption, where the issue is concentrated, and how long it might last.
What Is a Twitter Outage Map
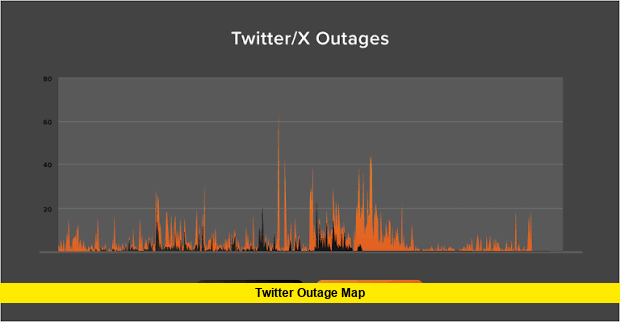
A twitter outage map is a visual tool, most commonly associated with services like DownDetector, that plots user-submitted problem reports by geographic location. Instead of relying on an official statement from X, which can sometimes take time to appear, these maps aggregate real-time complaints from users who say they cannot load their timeline, send a direct message, post a tweet, or log in. The result is a heat map showing which cities or regions are reporting the most trouble at any given moment.
These maps do not measure X’s internal server health directly. Instead, they track a proxy signal: the volume and location of people reporting issues. A sudden spike in reports from a specific region, or a nationwide surge, is usually a strong indicator that something is genuinely wrong with the platform rather than an isolated connectivity issue on one person’s end.
How the Outage Map Actually Works
Outage tracking sites typically work by allowing users to submit a quick report describing their problem, such as difficulty loading the app, issues with the website, or trouble sending posts. These reports are then compiled and layered onto a map using location data tied to the report submissions. When enough reports come in from a concentrated area within a short window, the site flags that region as experiencing a possible outage.
Common categories tracked during an X disruption include:
- Website access issues, where x.com fails to load or displays a blank or endlessly spinning screen
- Mobile app problems, where the app crashes, freezes, or won’t refresh the timeline
- Login failures, where users are stuck in a loop trying to sign in
- Posting or uploading errors, where tweets, images, or videos fail to send
Because X is a global platform running on centralized infrastructure, outages tend to affect users broadly rather than in just one city or country. When the platform goes down, it is common for reports to surge simultaneously across multiple regions rather than spreading gradually, which is different from, say, a regional internet provider outage.
Recent Outage Activity on X
X has experienced a number of service disruptions throughout 2026, and the pattern shows that brief outages are not unusual for the platform. Reports on outage tracking sites indicated a period of intermittent access issues on July 18, 2026, with users describing trouble reaching the service in the early morning hours, though the scale was considerably smaller than some of the platform’s larger incidents earlier in the year.
Looking back over the year, X saw one of its more significant disruptions in March 2026, when tens of thousands of user reports were logged within roughly an hour as the platform experienced what appeared to be a broad connectivity failure. That incident followed a similar pattern seen in earlier outages, where reports spike quickly, peak within 20 to 30 minutes, and then taper off as service is restored. There have also been shorter, less severe incidents recorded in the months since, including brief spikes in reports during June 2026, underscoring that occasional hiccups have become a recurring feature of the platform’s operations.
It’s worth noting that the exact cause of any individual outage is not always confirmed right away. In some past cases, X’s leadership has attributed disruptions to cyberattacks, while other incidents have been linked to internal technical issues or data center problems. Unless X or a verified official source confirms a specific cause, the reason behind any given outage should be treated as unconfirmed rather than assumed.
Why Outages Happen and What They Typically Look Like
X operates as a large-scale, centralized social media platform, which means that when something breaks at the infrastructure level, it tends to affect a large number of users at once rather than just a small subset. Typical symptoms reported during past incidents include:
- The timeline failing to refresh or getting stuck on older posts
- Persistent “Something went wrong” error messages
- Images and videos not loading properly
- Difficulty logging in or being repeatedly logged out
- Notifications and direct messages not updating
In many cases, only part of the platform is affected. For example, the website might go down while the mobile app continues functioning, or posting might fail while simply browsing the timeline still works. This is why checking a twitter outage map alongside the app itself can help clarify whether an issue is widespread or specific to one feature.
How to Check If X Is Down Right Now
For anyone trying to determine whether X is experiencing a broader outage rather than a personal connectivity issue, a few simple steps can help:
- Check a crowd-sourced outage tracking site to see if reports are spiking in your area or globally
- Try switching between WiFi and mobile data, or test the platform from a different device, to rule out a local network problem
- Look for official updates from accounts dedicated to platform support, since these are sometimes used to acknowledge major incidents
- Distinguish between a full outage and a rate-limit message, since X applies temporary limits on how many posts a user can view in a given period, which can sometimes be mistaken for a service failure
If reports on outage tracking platforms are climbing rapidly across multiple regions and you’re also personally unable to access the service, that combination is generally a reliable sign that the issue extends beyond your own device or connection.
Public Interest in Outage Tracking
Interest in twitter outage map tools tends to spike sharply whenever users start experiencing problems, since people want quick confirmation of whether an issue is widespread before assuming it’s a problem with their own device. This has made outage tracking sites a go-to resource during moments of platform instability, especially given that X’s own status communications don’t always update immediately when problems begin.
The recurring nature of these disruptions throughout 2026 has also kept public attention on the topic, as users have grown accustomed to periodically checking outage maps whenever their feed stops loading or their app throws unexpected errors. For a platform used by hundreds of millions of people daily, even short interruptions can generate a large volume of reports within minutes.
Final Thoughts
A twitter outage map remains one of the fastest ways for users to confirm whether X is experiencing a genuine service disruption or whether an issue is isolated to their own connection or device. Given that X has faced multiple bouts of instability throughout 2026, from brief regional blips to larger nationwide incidents, keeping an eye on outage tracking tools has become a practical habit for frequent users. As with any developing technical issue, specific causes and resolution timelines should be treated as unconfirmed until verified by X directly or a credible reporting source.
Stay tuned for the latest updates, and feel free to share your own experience in the comments if you’re seeing issues with X today.