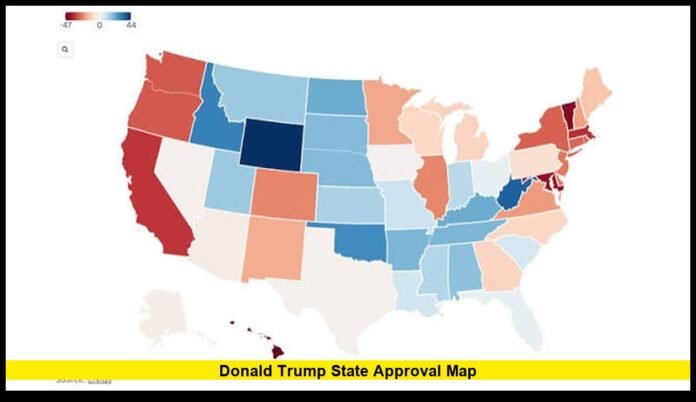

The Donald Trump state approval map shows major differences in how Americans view President Donald Trump across the country as the 2026 midterm elections approach. Recent state-level polling data places Trump well above water in a small group of strongly Republican states, while his approval remains substantially underwater in most states.
The latest national polling also shows a challenging environment for the president. A Reuters/Ipsos survey conducted August 28–31 found that 33% of Americans approved of Trump’s job performance, while 65% disapproved. The result marked his third consecutive 33% approval reading in that poll.
State-level polling adds important detail that a national number cannot provide. Trump’s support remains strongest in states that have consistently backed Republican presidential candidates. His weakest numbers appear in Democratic-leaning states, while several important swing states also show more disapproval than approval.
What the Latest State Approval Map Shows
The current state-level picture is highly polarized.
A Civiqs-based state analysis places Trump above water in only 11 states. He is below water in 39 states. The figures measure job approval among registered voters and use rolling polling data.
The strongest approval numbers are concentrated in the northern Plains, Mountain West and parts of the South.
North Dakota currently ranks near the top, followed by West Virginia and Wyoming. South Dakota, Montana and Oklahoma also remain among the states where Trump’s approval is strongest.
At the other end of the map, Hawaii records the weakest rating. Vermont, Maryland, Massachusetts and California also show particularly large gaps between approval and disapproval.
The difference between the strongest and weakest states demonstrates how much geography continues to shape presidential approval.
States Where Trump Has the Highest Approval
North Dakota has emerged as one of Trump’s strongest states in the latest state-level polling.
West Virginia and Wyoming also remain firmly in positive territory. South Dakota, Montana and Oklahoma round out the states with especially favorable approval numbers.
The strongest group includes:
- North Dakota
- West Virginia
- Wyoming
- South Dakota
- Montana
- Oklahoma
- Idaho
- Arkansas
- Alabama
- Kansas
- Tennessee
Trump’s approval is not equally strong throughout this group. Some states sit only slightly above the approval-disapproval break-even point.
That distinction is important when interpreting a map. A state with a narrow positive rating should not be treated the same as a state where approval exceeds disapproval by a wide margin.
Still, the overall pattern is clear. Trump’s strongest support remains concentrated in states with a strong Republican voting history.
North Dakota Remains a Stronghold
North Dakota stands out because Trump’s approval remains comfortably above his disapproval level.
The state’s political environment has been strongly Republican in recent presidential elections. That broader partisan alignment continues to be reflected in presidential approval polling.
West Virginia presents a similar pattern.
The state has become one of the country’s most reliably Republican states at the presidential level. Trump’s approval there remains significantly stronger than his national rating.
Wyoming also remains favorable territory for Trump, although its approval level has fallen substantially from earlier in his second term.
That movement matters because it shows that Republican states are not completely insulated from changes in national sentiment.
The Weakest States on the Map
The bottom of the map looks very different.
Hawaii currently has the lowest Trump approval among the states included in the latest Civiqs-based analysis. Vermont, Maryland, Massachusetts and California also rank near the bottom.
These states share a common political characteristic: each has generally favored Democratic presidential candidates.
The latest estimates place Trump’s approval at roughly:
| State | Approval | Disapproval |
|---|---|---|
| Hawaii | 18% | 78% |
| Vermont | 20% | 74% |
| Maryland | 22% | 72% |
| Massachusetts | 25% | 71% |
| California | 25% | 70% |
The size of the gap is striking.
In Hawaii, for example, disapproval is more than four times the approval level.
California also remains strongly negative despite its large population and importance to the national political landscape.
These figures do not mean every resident of these states opposes Trump. They show that a much larger share of surveyed residents disapprove of his job performance.
Trump’s Numbers in the Swing States
The most closely watched portion of the map involves the states that can play an important role in national elections.
The seven states widely regarded as the major 2024 presidential battlegrounds are Arizona, Georgia, Michigan, Nevada, North Carolina, Pennsylvania and Wisconsin.
Recent state-level polling shows Trump’s approval below his disapproval level in all seven.
The approximate net approval figures in the latest Civiqs-based analysis are:
- Arizona: -16
- Georgia: -23
- Michigan: -20
- Nevada: -28
- North Carolina: -13
- Pennsylvania: -18
- Wisconsin: -16
Net approval is calculated by subtracting the disapproval percentage from the approval percentage.
A negative figure therefore means disapproval exceeds approval.
The numbers show that Trump faces a difficult approval environment across the major battleground states.
However, approval ratings should not be confused with election results. They measure public opinion about presidential performance rather than asking voters which candidate they intend to support in a particular contest.
North Carolina Is Different From Nevada
The seven battlegrounds are not identical.
North Carolina currently has the least negative net approval among the group. Nevada sits at the other end with the largest negative gap.
Arizona and Wisconsin fall closer together, while Pennsylvania and Michigan also show significant negative ratings.
Georgia has also recorded a substantial gap between approval and disapproval.
These differences demonstrate why a nationwide average cannot fully describe the political environment in competitive states.
A few percentage points can separate one state from another, but the broader trend is more important: Trump’s approval is underwater across the major battleground group in the latest state-level data.
Texas and Florida Also Deserve Attention
Texas and Florida are especially notable because both have become important Republican states at the presidential level.
Yet neither currently ranks among Trump’s strongest states on approval.
Texas shows a significant negative approval balance in the latest state-level estimates. Florida also has more residents disapproving than approving.
That does not mean these states have suddenly become Democratic states.
Presidential approval and partisan voting behavior are separate measurements.
A state can remain strongly Republican while voters express dissatisfaction with a particular president.
This is one of the most important points to understand when reading the state map.
Republican States Are Not Immune From Falling Approval
One of the more significant developments in the latest state data is the decline in Trump’s approval even in states that strongly supported him.
The movement is particularly noticeable when current numbers are compared with the beginning of his second term.
Wyoming, South Dakota and Alabama remain more favorable toward Trump than many Democratic states. Yet each has experienced a decline in net approval.
Idaho and Tennessee also show weaker approval than they did earlier in the second term.
This creates a more complicated picture than simply dividing the country into red and blue states.
The strongest Republican states still tend to provide Trump with his best approval ratings. However, his numbers have weakened in many of those states.
Why the National Number and State Map Can Look Different
National approval polling combines respondents from all parts of the country.
A state map breaks that national picture into individual geographic areas.
That produces substantial differences.
A president can have a national approval rating in the low 30s while still receiving approval from more than half of voters in some states.
At the same time, approval can fall below 25% in other states.
The latest Reuters/Ipsos national survey illustrates the broader challenge. It found Trump’s approval at 33%, with 65% disapproving.
Another recent poll has produced a higher approval figure, demonstrating that polling organizations can reach different results because of differences in samples, methodologies and survey timing.
For that reason, readers should avoid combining numbers from different polling organizations as if they came from one survey.
What Net Approval Means on the Map
Net approval is useful because it quickly shows the balance between approval and disapproval.
Suppose a state has 40% approval and 55% disapproval.
Its net approval is -15.
That does not mean 15% of voters oppose the president. It means disapproval is 15 percentage points higher than approval.
The same calculation works in the other direction.
A state with 52% approval and 40% disapproval would have a net approval of +12.
The map therefore makes it easier to compare the direction of opinion across states.
Why Some States Can Move More Than Others
State polling contains uncertainty.
Smaller states generally have fewer respondents available than large states. That means estimates can move more from one polling period to another.
A two-point difference between states should not automatically be treated as meaningful.
The broader direction matters more.
The latest state data clearly shows a wide divide between strongly Republican states and strongly Democratic states.
It also shows that many states that supported Trump in 2024 now have negative approval balances.
Trump’s National Approval Remains Under Pressure
The state map comes as Trump’s national approval has faced significant pressure during the summer of 2026.
Reuters/Ipsos reported that Trump’s 33% approval rating remained unchanged across three consecutive surveys. The latest survey also found broad dissatisfaction with his handling of major issues.
The cost of living remains particularly important to voters heading into the midterms. A Reuters/Ipsos survey released August 31 found that 47% of registered voters identified the cost of living as the single most important factor in deciding their 2026 midterm vote.
Those national findings help explain why presidential approval is receiving increased attention as Election Day approaches.
The state map, however, provides a more detailed view of where that sentiment is strongest.
Why the 2026 Midterms Add Importance
The 2026 midterm elections are scheduled for November 3.
That puts increasing attention on presidential approval in competitive states.
Members of Congress from both parties will campaign under very different local conditions. A president’s approval can shape the political environment, but it does not determine the result of an individual House or Senate race.
Local candidates, turnout, campaign spending, national issues and state-specific concerns can all affect an election.
The approval map should therefore be treated as an indicator of the political climate rather than an election forecast.
The Map Shows a Wider Political Divide
The most obvious feature of the current state map is the geographic divide.
The states with the highest approval are concentrated in areas that have strongly supported Trump and the Republican Party.
The states with the lowest approval are concentrated in Democratic strongholds.
The battlegrounds fall between those two groups, but current approval remains negative across all seven major 2024 swing states.
That combination produces a complicated national picture.
Trump maintains a strong base in several Republican states while facing significant disapproval elsewhere.
What Readers Should Watch Next
Future state polling will determine whether the current pattern remains stable.
The most important changes will likely come from states where approval and disapproval are relatively close.
States with extremely large approval gaps are less likely to change from one category to another after a small polling movement.
The competitive states deserve particular attention because relatively modest changes in public sentiment can alter the political environment.
Arizona, Georgia, Michigan, Nevada, North Carolina, Pennsylvania and Wisconsin will remain important parts of any discussion about Trump’s state-level approval.
Texas and Florida will also be useful to watch because their current numbers demonstrate that Republican states can show dissatisfaction even when their broader partisan identity remains firmly Republican.
How to Understand the Latest Donald Trump State Approval Map
The latest data does not show a uniformly popular or uniformly unpopular president.
Instead, it shows a country where presidential approval varies dramatically by state.
North Dakota, West Virginia, Wyoming and several other Republican states continue to provide Trump’s strongest numbers.
Hawaii, Vermont, Maryland, Massachusetts and California remain at the opposite end.
The seven major battleground states are currently underwater on approval, adding another important dimension to the national picture.
At the same time, Trump’s approval has weakened in several states that previously provided him with some of his strongest support.
That combination makes the state-by-state data more informative than any single national percentage.
Final Takeaway
The current donald trump state approval map highlights a country divided sharply along political and geographic lines. Trump’s strongest approval remains concentrated in Republican-leaning states, while Democratic states show substantially higher disapproval. The major swing states also currently show negative approval balances.
National polling reinforces the difficult environment, with Reuters/Ipsos reporting 33% approval and 65% disapproval in its latest survey.
The numbers can change as new surveys are conducted, so the most useful way to follow the map is to look at consistent polling trends rather than isolated movements.
What do you think the latest state-by-state approval numbers say about Trump’s standing across the United States? Share your thoughts and stay informed as new polling develops.