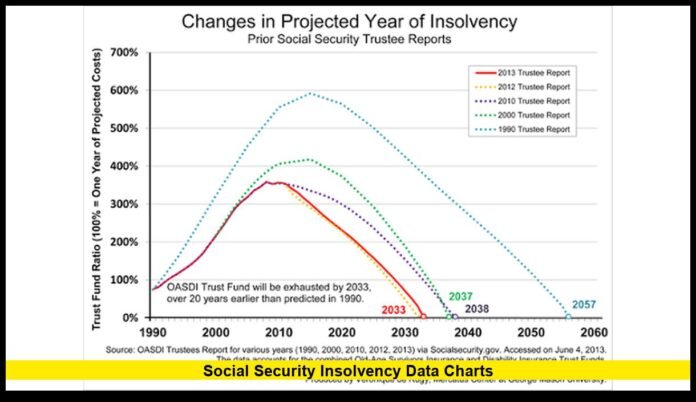

Social Security insolvency data charts show that the combined Social Security trust funds remain on track for depletion in 2034, with enough continuing income projected to cover about 83% of scheduled benefits after reserves run out.
The latest 2026 Social Security Trustees Report, released June 9, provides the most current official financial projections for the program. It estimates that the combined Old-Age and Survivors Insurance (OASI) and Disability Insurance (DI) trust fund reserves stood at about $2.56 trillion at the end of 2025. The reserves are projected to decline during the coming years as Social Security costs continue to exceed total income.
The 2026 report keeps the combined trust fund depletion date at 2034, the same year projected in the 2025 report. However, the latest report changes several important numbers, including the projected percentage of benefits payable after depletion and the size of the program’s long-term financing gap.
What the Latest Social Security Insolvency Data Shows
Social Security’s financial condition is measured primarily through its two legally separate trust funds: OASI and DI. OASI finances retirement and survivor benefits, while DI finances disability benefits. The Trustees often combine the two funds when presenting the broader financial position of Social Security, calling the combined program OASDI.
The latest numbers show a clear difference between the two funds.
The OASI Trust Fund is projected to become depleted in the fourth quarter of 2032. At that point, continuing program income would cover approximately 78% of scheduled OASI benefits.
The DI Trust Fund is in a substantially stronger position. The Trustees project that its reserves will remain sufficient to pay scheduled disability benefits throughout the 75-year projection period ending in 2100.
When the two funds are considered together, the projected depletion date is the third quarter of 2034. Continuing income at that point would cover about 83% of scheduled OASDI benefits.
Latest Social Security Trust Fund Chart
| Measure | 2026 Trustees Projection |
|---|---|
| Combined trust fund reserves at end of 2025 | $2.56 trillion |
| OASI depletion | Q4 2032 |
| OASI benefits payable at depletion | 78% |
| Combined OASDI depletion | Q3 2034 |
| OASDI benefits payable at depletion | 83% |
| DI depletion through 2100 | Not projected |
| OASDI 75-year actuarial deficit | 4.42% of taxable payroll |
| OASDI actuarial deficit as share of GDP | About 1.5% |
These figures represent the Trustees’ intermediate assumptions, which the report describes as the best-estimate assumptions for demographic, economic and program-specific conditions.
Social Security Trust Fund Reserves Are Falling
One of the most important numbers in the latest Social Security insolvency data charts is the size of the trust fund reserves.
The combined OASI and DI reserves ended 2025 at approximately $2.56 trillion. That represented a decline of about $160 billion during the year.
The decline reflects a fundamental change in Social Security’s cash-flow position. Program costs now exceed total income, meaning the trust funds must use accumulated reserves to help finance scheduled benefits.
The Trustees reported that total cost first exceeded total income in 2021. They project that the gap will continue throughout the long-range projection period under current law and the report’s intermediate assumptions.
The 2026 report estimates total Social Security income of about $1.493 trillion for 2026. Total cost is projected at approximately $1.697 trillion.
That produces a projected annual gap of roughly $204 billion when total income is compared with total cost.
2026 Social Security Income and Cost Chart
| 2026 Measure | Projected Amount |
|---|---|
| Non-interest income | $1.426 trillion |
| Interest income | $67 billion |
| Total income | $1.493 trillion |
| Total cost | $1.697 trillion |
| Approximate income-cost gap | $204 billion |
| Projected year-end reserves | $2.358 trillion |
The official dollar projections show that Social Security is expected to continue drawing down reserves in 2026.
Social Security Reserve Decline Through 2033
The latest data provides a particularly useful view of how quickly combined reserves are projected to decline before depletion.
Under the Trustees’ intermediate assumptions, combined reserves are projected to fall from about $2.358 trillion at the end of 2026 to approximately $154.8 billion at the end of 2033 when measured in CPI-indexed 2026 dollars.
The figures below use the official 2026 Trustees projections.
Social Security Reserve Depletion Chart
| Year | Total Income | Total Cost | Year-End Reserves |
|---|---|---|---|
| 2026 | $1.493T | $1.697T | $2.358T |
| 2027 | $1.506T | $1.756T | $2.052T |
| 2028 | $1.551T | $1.806T | $1.749T |
| 2029 | $1.585T | $1.852T | $1.441T |
| 2030 | $1.616T | $1.897T | $1.127T |
| 2031 | $1.647T | $1.938T | $810B |
| 2032 | $1.676T | $1.981T | $485B |
| 2033 | $1.703T | $2.022T | $155B |
These figures are expressed in CPI-indexed 2026 dollars in the Trustees’ detailed tables.
The trend is significant because the annual gap becomes larger as the projection advances. Income continues to rise, but program costs rise faster.
By 2033, projected reserves are only a fraction of the amount held at the beginning of the period. The combined funds then reach projected depletion in 2034.
What 2034 Means for Social Security Benefits
The word “insolvency” can create confusion when discussing Social Security.
A projected trust fund depletion does not mean that Social Security would suddenly have no money coming into the program. Workers would continue paying Social Security taxes, and other program income would continue.
The issue is that continuing income would not be enough to finance 100% of scheduled benefits under current law.
The 2026 Trustees Report estimates that continuing income would cover approximately 83% of scheduled combined OASDI benefits when the trust fund reserves become depleted in 2034.
That makes the distinction between trust fund depletion and the end of Social Security especially important.
The program would still collect revenue. The projected problem is that revenue would fall short of the amount required to pay all benefits scheduled under current law.
The 83% figure is therefore not a prediction that every beneficiary will automatically receive exactly 83% of his or her current check. It represents the projected ratio of continuing income to scheduled program cost.
OASI Faces an Earlier Depletion Date
The OASI Trust Fund accounts for retirement and survivor benefits, making its financial position particularly important for retirement planning.
The 2026 Trustees Report projects OASI reserve depletion in the fourth quarter of 2032. That is one quarter earlier than the 2033 first-quarter projection in the 2025 report.
At OASI reserve depletion, continuing income would be enough to pay about 78% of scheduled OASI benefits.
OASI vs. Combined Social Security Chart
| Measure | OASI | Combined OASDI |
|---|---|---|
| Projected depletion | Q4 2032 | Q3 2034 |
| Benefits payable at depletion | 78% | 83% |
| 75-year actuarial balance | -4.55% | -4.42% |
| Full benefits through 2100? | No | No |
The DI Trust Fund remains projected to pay full scheduled benefits throughout the 2026-2100 projection period.
The combined projection assumes that lawmakers allow the legally separate OASI and DI funds to transfer resources between them as needed to maintain full scheduled benefits until the combined reserves are depleted.
Why the Social Security Financing Gap Is Growing
The latest Social Security insolvency data charts show more than just a single depletion year. They show a continuing mismatch between program income and cost.
The Trustees project that total OASDI cost will exceed total income in every future year of the projection period.
This pattern reflects long-term demographic and economic factors built into the Trustees’ assumptions. The number and age distribution of beneficiaries affect benefit costs, while the size and earnings of the working population affect taxable payroll and revenue.
The latest report also shows that Social Security’s long-term actuarial deficit has increased.
For 2026 through 2100, the combined OASDI actuarial deficit is projected at 4.42% of taxable payroll. The comparable figure in the 2025 report was 3.82%.
75-Year Social Security Financing Gap
| Measure | 2025 Report | 2026 Report |
|---|---|---|
| OASDI actuarial deficit | 3.82% of taxable payroll | 4.42% |
| Approximate GDP share | 1.3% | 1.5% |
| Combined reserve depletion | 2034 | 2034 |
| Benefits payable at depletion | 81% | 83% |
The depletion year did not move between the two reports, but the long-term actuarial deficit became larger.
The Trustees identify changes in demographic and economic assumptions, along with other factors, as contributors to the change. The report states that the change to the ultimate fertility-rate assumption was the largest contributor to the increased deficit.
The Long-Term Unfunded Obligation
Another important figure in the latest Social Security insolvency data charts is the program’s long-term unfunded obligation.
The 2026 Trustees Report estimates that the combined OASI and DI Trust Funds have a present-value unfunded obligation of approximately $29.3 trillion through the end of 2100.
The report also measures this unfunded obligation as 4.24% of taxable payroll and approximately 1.5% of GDP over the 2026-2100 period.
This measure differs slightly from the 4.42% actuarial deficit because the actuarial balance calculation includes the cost of ending the 75-year period with a target trust fund reserve equal to one year’s cost.
Both measures point toward the same broad conclusion: Social Security’s current financing structure does not provide enough projected income to maintain scheduled benefits indefinitely without changes to program financing or benefits.
Social Security Income and Cost: The Direction of the Chart
The most revealing aspect of the latest data is the direction of the income and cost lines.
In 2026, total income is projected at approximately $1.493 trillion, compared with about $1.697 trillion in cost.
By 2030, the Trustees project total income of roughly $1.778 trillion and total cost of about $2.087 trillion.
By 2035, projected income reaches approximately $2.624 trillion, while projected cost reaches about $2.673 trillion in nominal dollars.
The annual gap becomes considerably larger later in the projection period.
Income vs. Cost Projection Chart
| Year | Total Income | Total Cost | Difference |
|---|---|---|---|
| 2026 | $1.493T | $1.697T | -$204B |
| 2030 | $1.778T | $2.087T | -$308B |
| 2035 | $2.624T | $2.673T | -$49B* |
| 2040 | $3.339T | $3.419T | -$80B* |
| 2050 | $4.826T | $5.876T | -$1.05T* |
*Figures above are from the Trustees’ current-dollar projections and are subject to rounding and the report’s assumptions.
The Trustees’ detailed tables show that the relationship between income and cost changes over time, with the long-term financing imbalance becoming more pronounced in later decades.
What the 2026 Data Says About 2100
The financial problem does not stop in 2034.
The 2034 date represents the projected depletion of combined trust fund reserves. After that point, continuing income would finance only part of scheduled benefits.
The Trustees project that continuing income would equal approximately 65% of program cost by 2100 under the intermediate assumptions.
The 2026 report therefore presents a long-term financial challenge rather than a single-year event.
The reserve depletion date marks the point when accumulated assets are projected to run out. The underlying gap between program income and scheduled costs continues beyond that date.
This is why Social Security solvency discussions often examine both the depletion date and the 75-year actuarial balance.
What Could Change the Social Security Insolvency Charts
The projections are based on current law and the Trustees’ intermediate assumptions. They are not fixed outcomes.
Changes to Social Security law could alter future income, future costs, or both.
The Trustees identify broad categories of policy approaches that could improve the program’s long-term finances. These include increasing revenue, changing benefit provisions, or combining revenue and benefit changes.
The specific effect would depend on the legislation enacted, when changes took effect, and which workers and beneficiaries were affected.
For that reason, the 2034 depletion date should be viewed as the latest official projection under the law and assumptions used in the 2026 Trustees Report, rather than as a guaranteed event.
Social Security Insolvency Data Charts: Key Numbers to Remember
For readers tracking the latest Social Security financial data, several figures stand out from the 2026 report:
- $2.56 trillion: Combined OASI and DI reserves at the end of 2025.
- 2032: Projected OASI reserve depletion year.
- 78%: OASI scheduled benefits payable from continuing income at depletion.
- 2034: Projected combined OASDI reserve depletion year.
- 83%: Scheduled combined benefits payable from continuing income at depletion.
- $1.493 trillion: Projected combined Social Security income in 2026.
- $1.697 trillion: Projected combined Social Security cost in 2026.
- 4.42%: OASDI’s projected 75-year actuarial deficit as a percentage of taxable payroll.
- $29.3 trillion: Present-value unfunded obligation through 2100.
- 65%: Projected continuing income as a share of program cost in 2100.
These numbers provide a concise picture of the latest Social Security financial outlook.
Bottom Line on Social Security Insolvency Data
The latest Social Security insolvency data charts show that the program remains financially strained, but they do not show Social Security disappearing in 2034. The official 2026 projection places combined trust fund reserve depletion in the third quarter of 2034.
At that point, continuing income is projected to cover about 83% of scheduled benefits. OASI faces an earlier projected reserve depletion in the fourth quarter of 2032, while DI is projected to remain fully financed through 2100.
The most important change in the latest report is not the combined depletion year, which remains 2034. Instead, the report shows a larger 75-year actuarial deficit, rising from 3.82% to 4.42% of taxable payroll.
The data makes one point especially clear: Social Security’s financial challenge involves both the approaching depletion of accumulated reserves and a continuing gap between projected income and scheduled costs. The 2026 Trustees Report remains the latest official benchmark for tracking that outlook as of August 28, 2026.
What do you think the latest Social Security insolvency data charts show about the program’s financial future? Share your thoughts and stay tuned for the next verified update.