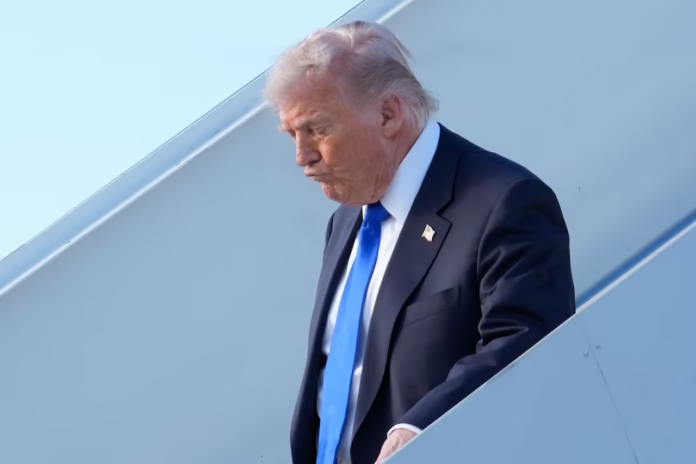

President Donald Trump’s approval rating has sunk to some of the lowest levels of his second term, with multiple national polls in July 2026 showing his net approval — the gap between those who approve and disapprove of his job performance — deep in negative territory. As the 2026 midterm elections approach, the numbers paint a consistent picture of eroding support across nearly every demographic group.
Where Trump’s Approval Stands Right Now
Several major pollsters released fresh numbers in mid-July 2026, and while the exact figures vary by methodology, the overall trend is unmistakable.
An Economist/YouGov poll conducted July 3–6 among 1,603 U.S. adult citizens found 35 percent approving of Trump’s performance and 61 percent disapproving, putting his net approval at minus 26 — matching the lowest point recorded in that series since May 2026, and tying the lowest net approval seen across both of Trump’s terms as well as Joe Biden’s presidency.
A separate Focaldata online poll released around the same time found Trump’s net approval at minus 23, which the pollster described as an all-time low in its own tracking series.
A Washington Post/Ipsos poll released July 16 put Trump’s approval at 37 percent and disapproval at 61 percent, unchanged from an April reading. Meanwhile, a CNBC survey conducted July 8–12 found a 40 percent approval and 59 percent disapproval rating, for a net approval of minus 22 — Trump’s worst marks on the economy specifically in CNBC’s polling history.
Weighted polling averages tell a similar story. As of mid-July, one aggregator put Trump’s approval at roughly 37.1 percent versus 58.9 percent disapproval, a net gap of about 22 points underwater. Nate Silver’s Silver Bulletin tracker, which blends a wider mix of polls, shows some recent improvement — moving from a second-term low of minus 20.2 in May to about minus 17.4 in mid-to-late July — though it still ranks Trump slightly worse off than his own first term at the same point, even as it edges narrowly ahead of where Biden stood at a comparable stage.
Younger Voters Are Souring Fastest
One of the more striking trends in the latest data involves voters aged 18 to 34. According to the July 2026 Echelon Insights Omnibus Survey, Trump’s approval among younger voters sits at just 35 percent, with 65 percent disapproving — a 30-point net negative rating. That’s notably worse than his 23-point net negative rating overall in the same survey.
Compared to July 2025, Trump’s net approval among younger voters has worsened by 14 points. Since he took office in January 2025, his standing with this age group has fallen by 37 points on a net basis. Given that younger voters turned out in meaningful numbers in the 2024 election, this decline could carry real weight heading into the 2026 midterms.
A Sharp Drop Among Black Voters
Trump’s numbers have also slipped significantly among Black voters. Economist/YouGov polling found his net approval rating among this group fell from minus 47 in early May to minus 73 by early August, with approval dropping to just 11 percent against 84 percent disapproval. Trump won 16 percent of the Black vote in 2024, so continued erosion here could matter for Republican strategy in competitive districts.
How Republicans, Democrats, and Independents Compare
Unsurprisingly, Trump’s approval numbers vary sharply along party lines. Among Republicans, his net approval remains strongly positive, though it has softened somewhat from earlier highs. Among Democrats, his net approval is deeply negative, and among independents — often the deciding bloc in competitive races — his net approval has also turned solidly negative, a warning sign for the GOP as midterm campaigning ramps up.
Where Trump Fares Worst on the Issues
Breaking down approval by issue shows where the president is losing the most ground. Trump polls significantly underwater on inflation and the cost of living, climate and environmental policy, and abortion. His numbers are somewhat better, though still negative overall, on immigration and the economy broadly. On the economy specifically, the CNBC poll found 61 percent of respondents said they are pessimistic about the country’s financial outlook — the highest share expressing pessimism since December 2023.
Why the Numbers Matter Heading Into the Midterms
Presidential approval ratings are widely viewed as one of the clearest early indicators of a party’s strength heading into midterm elections. Historically, presidents with net approval ratings this far underwater have seen their party lose ground in Congress. Analysts note that Trump’s current numbers — hovering in the high teens to high twenties negative depending on the poll — are historically weak for a president at this stage of a term, and the persistence of these numbers across multiple independent polling organizations suggests the decline reflects a broader shift in public sentiment rather than a single bad survey.
FAQ
What does “net negative” approval mean? Net approval is calculated by subtracting the disapproval percentage from the approval percentage. When more people disapprove than approve, the result is negative, meaning the president is “underwater” with the public.
What is Trump’s current approval rating? As of mid-to-late July 2026, most major polls place Trump’s approval in the mid-to-high 30s, with net approval ranging from around minus 17 to minus 26 depending on the pollster and methodology.
Which poll shows the worst numbers for Trump? The Economist/YouGov and Focaldata polls from early July 2026 recorded some of the lowest net approval figures of Trump’s second term, at minus 26 and minus 23 respectively.
Has any recent polling shown improvement? Yes. The Silver Bulletin aggregate showed Trump’s net approval improving from a second-term low of minus 20.2 in May 2026 to around minus 17.4 in July 2026, though it remains solidly negative.
Why are younger voters moving away from Trump? Polling data doesn’t specify a single cause, but the decline among 18-34 year-olds has been steady since Trump took office in January 2025, with economic concerns and cost-of-living pressures frequently cited as top issues in this age group across multiple surveys.
Presidential approval ratings will likely keep shifting as new economic data, policy decisions, and midterm campaigning unfold in the months ahead.
What do you think is driving Trump’s approval slide — the economy, immigration, or something else? Drop your take in the comments and check back for the latest polling updates.